


- 5472 views
- 5472 views
Overview
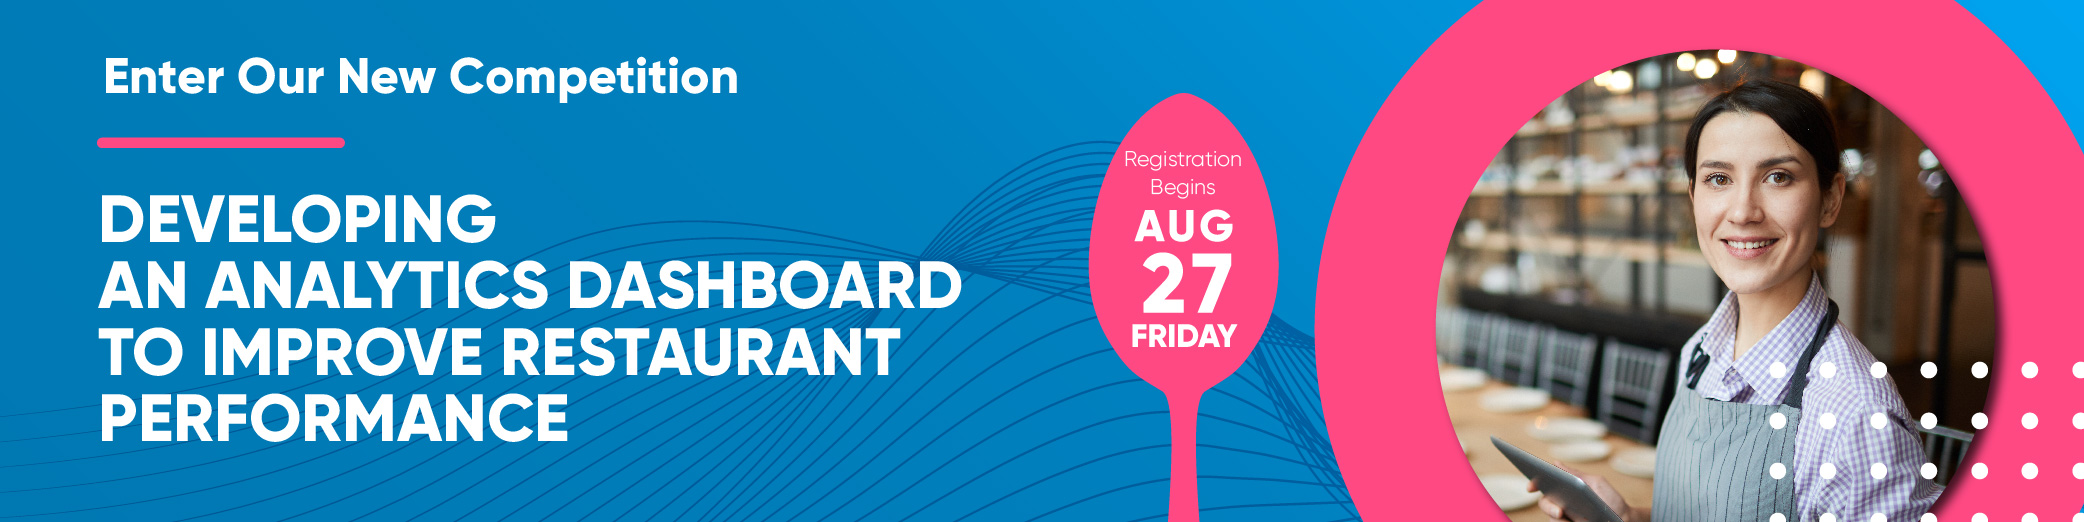
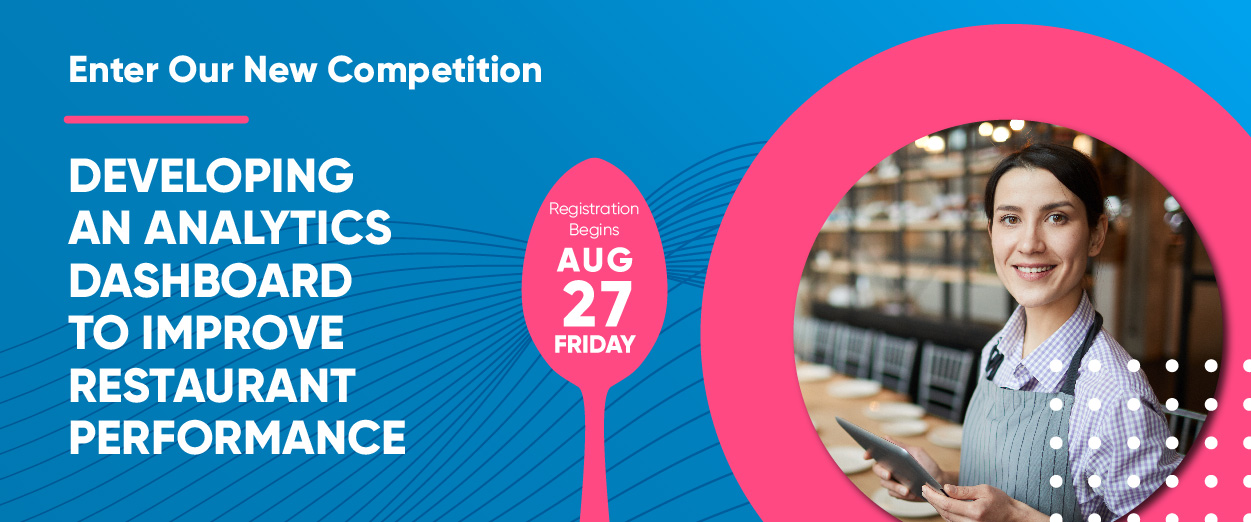
Digital technology and data-driven decision making have dramatically changed how restaurants stay competitive or to survive. As food delivery and online reservation become more and more popular, restaurants can hardly operate without using digital and data technologies. With this in mind, RMDS Lab is announcing its next data science competition, Developing an Analytics Dashboard to Improve Restaurant Performance.This quarter’s contestants will be challenged with collecting important data sets and then creating an analytics dashboard that will help restaurants to boost their businesses and improve their overall performance. A grant of $1,000 will be awarded to the grand prize winner, and $500 will go to the runner up.
Everyone who registers for the competition will receive FREE admission to IM Data Conference, and contestants who complete and submit their project will receive a FREE, one-month premium membership to GRMDS platform as well as a certificate of completion.
For contestants in High School:
For contestants NOT in High School:
Contestants will be challenged with building up an analytical dashboard with the datasets provided. Contestants are also welcome to research to get more data utilized in the dashboard. Through data research, analysis, feature extraction, and modeling, contestants should reach solid and meaningful conclusions about improving restaurant performance. Based on various studies, our contestants are expected to develop an analytical dashboard to showcase the business insights discovered in a way that is easily understood by restaurant decision-makers and simple for them to implement to stimulate performance improvement.
We have developed a dashboard as an example that our contestants could take advantage of and continue improving on it. Surprise us with your ideas!
Examples of analytical questions for competitors to explore may include:
• What are the factors influencing customer purchase at physical restaurants vs. online (or through 3rd party delivery)?
• What aspects (food, service, price and ambiance) are valued by customers in each food service type?
• What factors contribute to customer reviews and ratings?
• What are the site selection parameters, and what will drive the sales forecasting for a new location (in-store and online sales)?
• What type of restaurants would customers prefer? (pick-up/delivery, dine-in)
• How do restaurants collect data outside the POS?
• What is the optimal restaurant tenant mix per retail plaza or food court?
• What is the omni-channel strategy for various types of restaurants?
• What is the plug & play restaurant technology or technology stack (if any) for independent restaurants vs. multi-unit restaurants?
• What is the industry’s best practice for restaurant business analytics?
All perspectives are welcome! Show us your most valuable insights from your innovative data analytics that could benefit the restaurant industry.


Become a Sponsor or Partner today! Contact us!
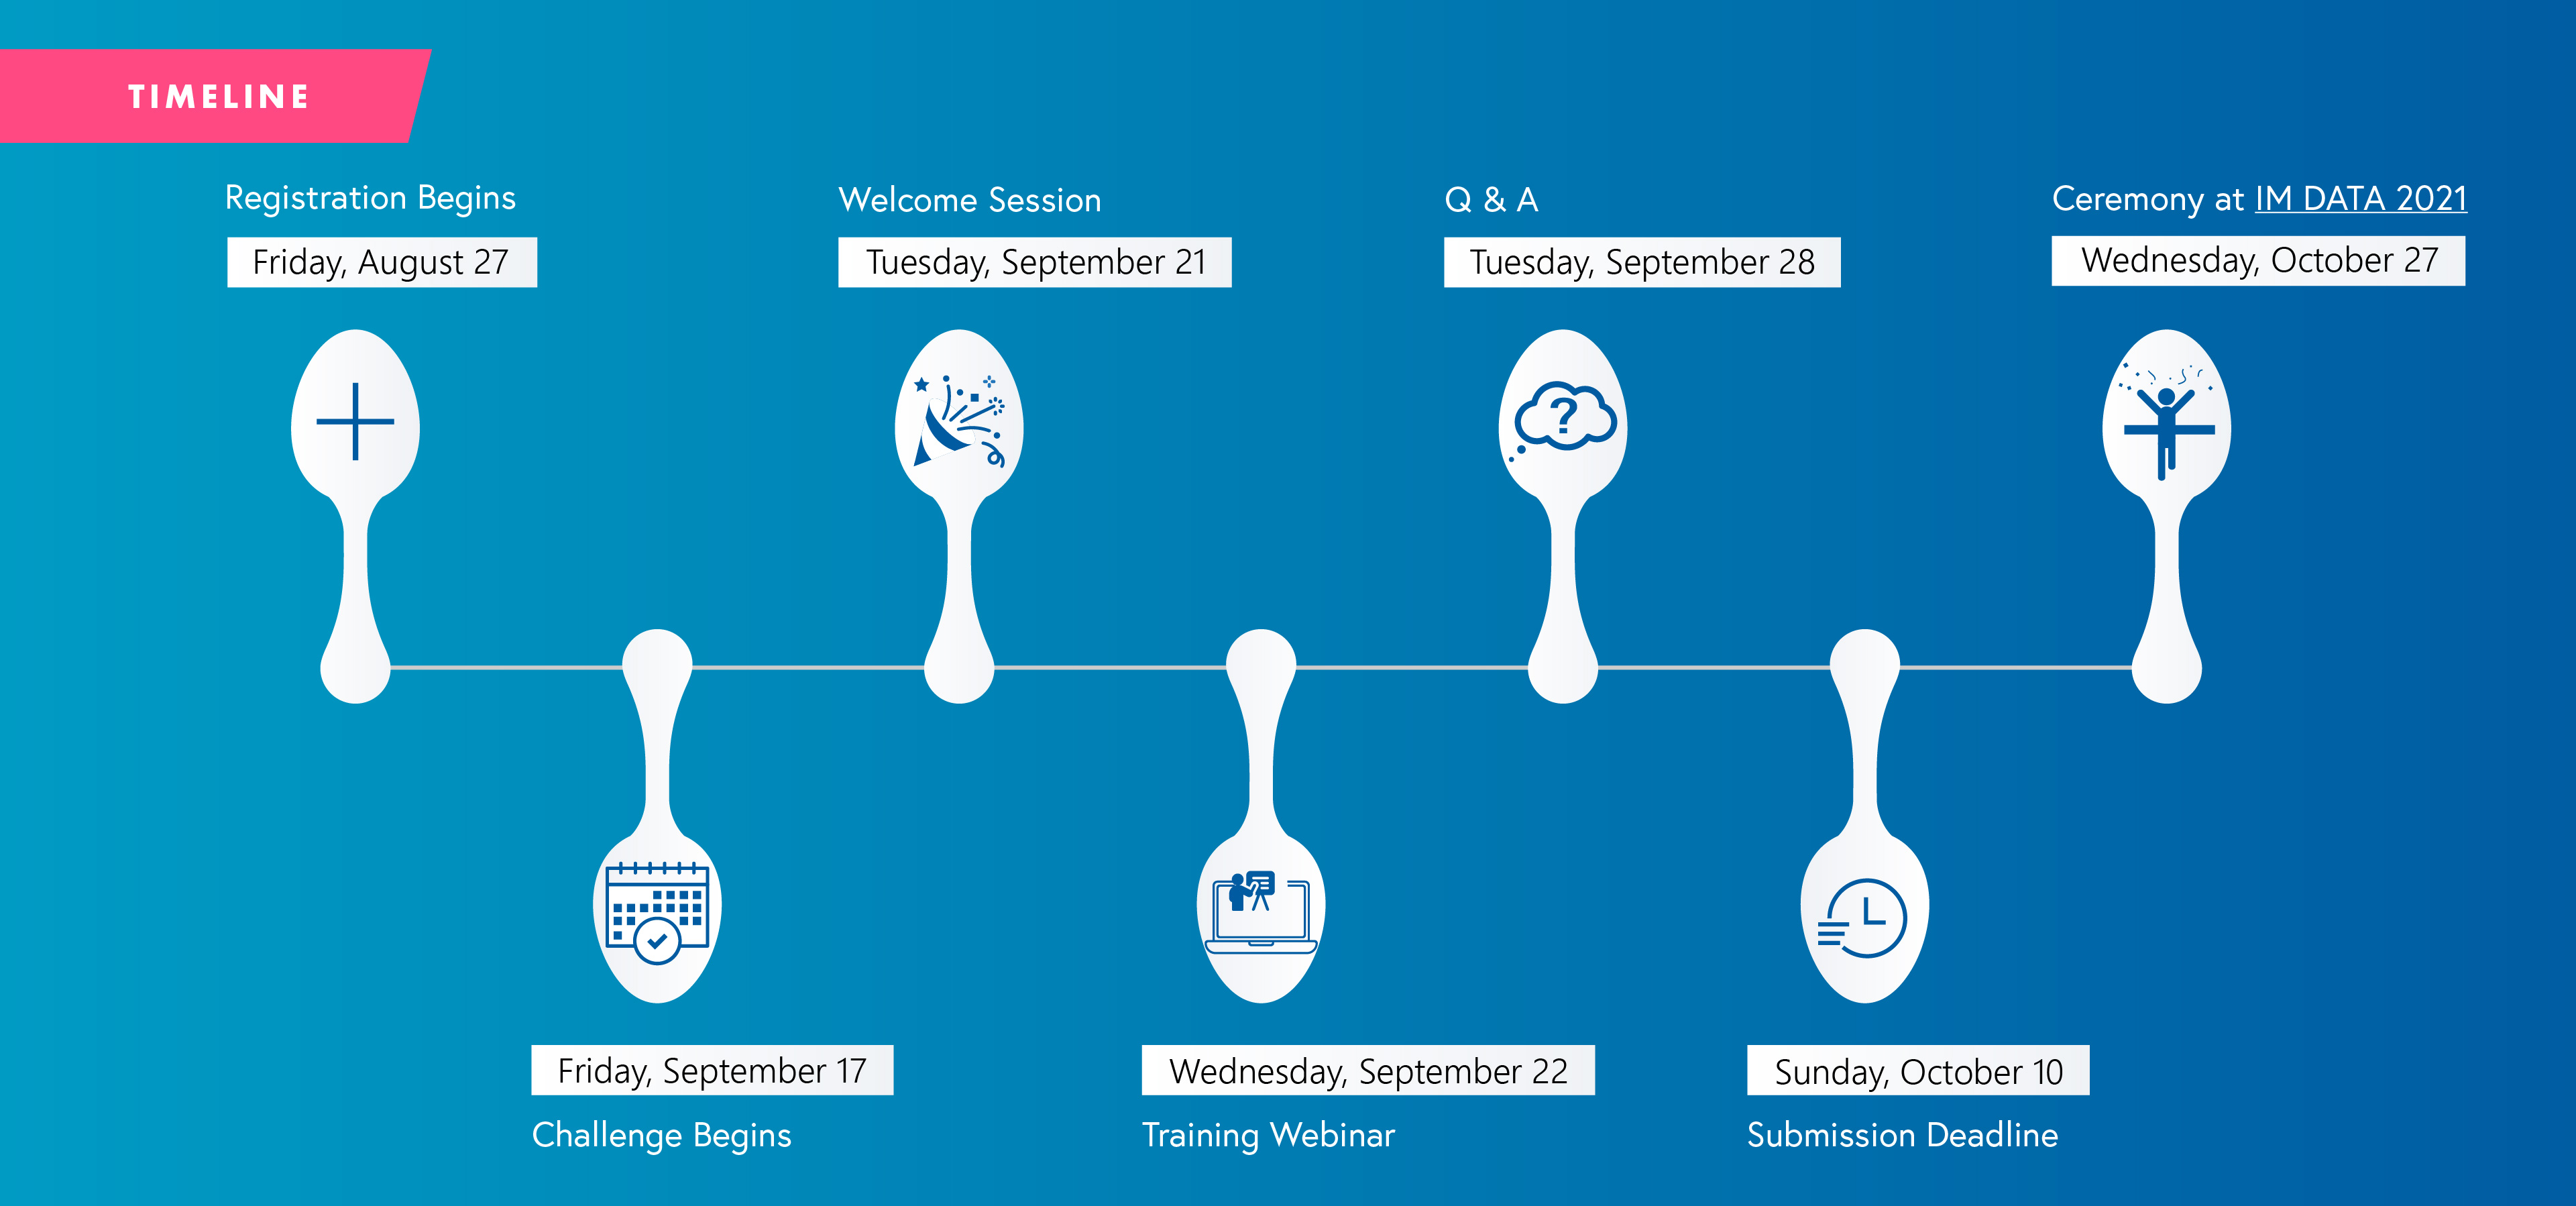
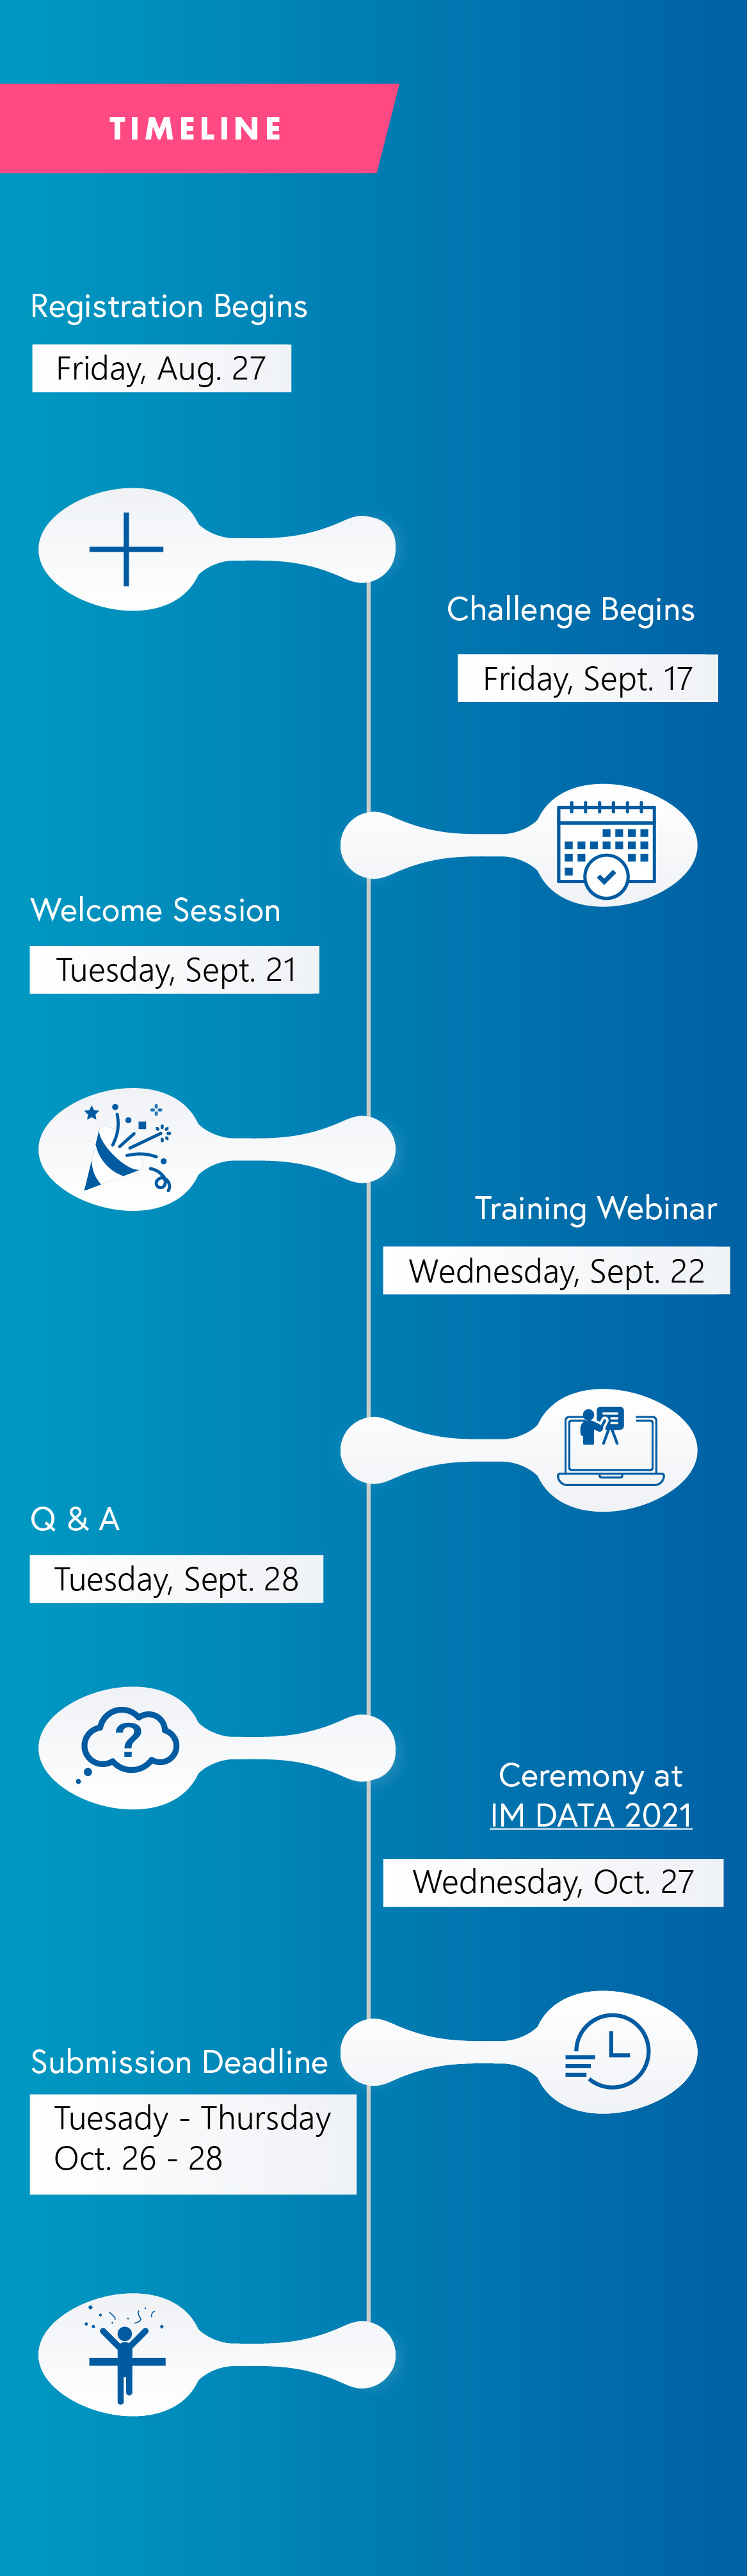
Timeline
The Problem
This data science competition seeks to collect data and then develop an analytical dashboard to improve restaurant performance. Contestants will be provided with the necessary data to begin with.
Dataset Overview
Participants will need to start with the dataset provided below to perform their analysis. This dataset contains the restaurant information in Los Angeles County. This dataset is published solely for the use of competition, please do not use it for other purposes.
There is also a recommended page for contestants to get access to some possible related datasets, ideas and how to get started in creating dashboards. Participants are encouraged to research and to collect more additional data to make their analysis more sensible and innovative.
⚠ You have to sign in to see the recommended page or download the sample dataset. The data would be available for downloading after the competition begins at September 17.
The recommended datasets include:
1. DEMOGRAPHIC DATA
This dataset comprises demographic data like population, age, sex, race and income, published by the US Census Bureau.
2. COVID DATA
Daily cases for LA County by neighborhood. These files come from a continual Times survey of California's 58 county health agencies and three city agencies.
3. CONSUMER PRICE INDEX
The Consumer Price Index (CPI) for food is a component of the all-items CPI. The CPI measures the average change over time in the prices paid by urban consumers for a representative market basket of consumer goods and services.
4. MOBILITY DATA
It includes multiple tables for different demographic people movements by race and by region.
5. WEATHER DATA
It includes data of temperature, wind, and others, summarized at daily, month and year level.
Resources
RMDS Lab offers our community a variety of educational resources focusing on data science applications and techniques. You may explore the RMDS learning portal containing various data science courses at learn.grmds.org.
Competitors may use the code “COMPETITION2021” to get complimentary access to our online course on Big Data and AI to Improve Competency and Employability.
Below are additional free resources:
If you have any questions regarding access to training materials and want to learn more about RMDS educational resources, you may use the Forum.
Submission Deliverables
By submitting to the contest, contestants agree to have their submissions made publicly available.
Evaluation
Impact: What useful business insights are acquired from the proposal? How does this submitted model benefit (or cost) businesses, and what actionable steps are recommended to improve their work?
Methodology Validity: Document the methodology, mathematics, and economic principles behind the proposal and provide the references or reasoning for your approach. How is the prediction generated and how are the factors weighted sensible? Are the assumptions and limitations of the methodology clearly outlined with suggestions to improve the proposal? Are the quantitative steps of data ingestion, feature engineering, model architecture, and performance optimization valid? How robust is your model?
Reproducibility: Does the solution use coding best practices with workflows and documentation to reproduce one’s work? Are the data ingress and egress pipelines reproducible? Is there a clear presentation of data science work in the documentation?
Usability: Is the information presented in a way that is actionable? Would a member of the general public understand the model, what it means, and what actions to take?
Ability to Deploy: Is getting access to the data realistic? How long is the computation time? How well is the scalability of the system to accept new data sources? How often does it need to be maintained? Is it hard to maintain/update? How much manpower, time, resources are needed to be allocated to maintain the functionality?
Fair and Ethical Use of Data: Does the solution consider biases in data? Is the data from open and trusted sources?
Innovation: Will the idea have a big impact? How innovative is the approach, selection and weighting of various factors, or how information is displayed and communicated?
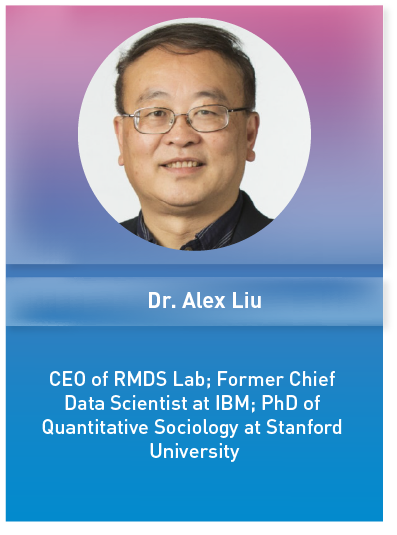
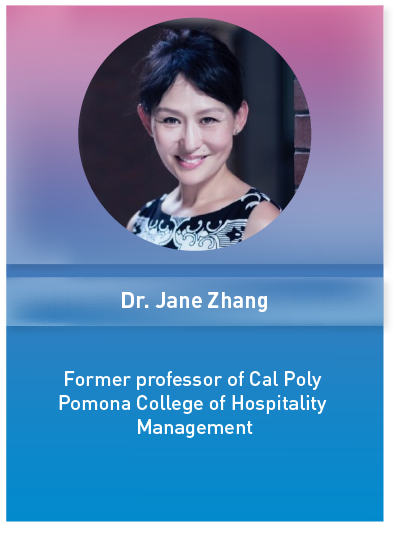
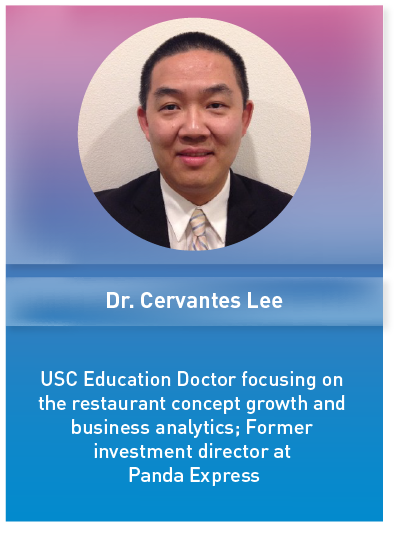
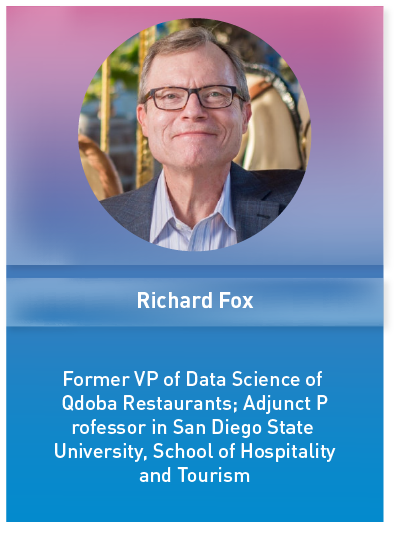
Judging Committee


Guidelines
Stage 1: Registration
Participants will register on GRMDS. We will send out a confirmation email to all participants upon successful registration. Once you form your team, one representative from your team must fill out the Team Registration Form. Please note that this competition is open to all participants globally. For any questions you may ask it on the Forum.
Stage 2: Team work and submission
Submissions must include all deliverables and are due Sunday, October 10, 11:59 PDT. Please upload all deliverables to the GRMDS. Place the names of all team members and team name on the technical report. Submission by any individual group member will represent the whole team.
Stage 3: Evaluation and Final Presentation
Our expert committee will evaluate all project deliverables and select the finalist teams at the Awards Ceremony.
Prizes
First Place
$1,000 + Certificate
Complimentary six month premium membership at RMDS Lab
Second Place
$500 + Certificate
Complimentary six month premium membership at RMDS Lab
High School Award
$500 + Certificate
Complimentary six-month premium membership at RMDS Lab
Rising Star Award
Considerations for internship positions at RMDS Lab + Certificate
Complimentary six-month premium membership at RMDS Lab
Winners will also be considered for publishing opportunities with our partners.
Code of Conduct
The use of data will adhere to ethical use and protection of individual data privacy. Find the Code of Conduct here.
We offer two options for registration based on age. For high school students, CLICK HERE. All other contestants can CLICK HERE. You must be signed in to view the form.
Participants are welcomed either as individuals or as teams. In the case of teams, one person must be designated as the team leader and will be solely responsible for communications with the organizers. If you are looking for teammates, advertise your interest on our Forum
Submissions can be made here. See above section “Submission Deliverables” to see what must be included in your submission.
There is no deadline for our registration. But we strongly recommend that your registration is no later than August 27, since you need time to prepare your work.
No minimum or maximum number.
The number of team members will not impact potential prize offerings. The prize offerings will remain the same.
Yes. We welcome people from different cities or countries to join our competition. This competition is open to the global community.
If you have any questions, you may ask in the Forum. We’ll get back to you as soon as we can.
If you need to update your team roaster, please submit the registration form again with all the team members information.
Please see resources listed on this page, including recordings of competition training sessions. There is also a dataset sample, data dictionary and further reading material.
Sign up for RMDS emails
Receive the latest news in data science from RMDS
Who We Are
RMDS is an ecosystem service provide that empowers data science professionals and businesses worldwide to achieve successful, data-driven results.
Read Our StoryBecome A Member
Our community members have access to tools and resources that enhance their research and increase the success rate of their work. Join today as an individual or organization.
Join Us TodayJoin Our Events
RMDS is now hosting monthly remote events. Bringing together, people from data science, data professional services, research methodology, AI and computing in the greater LA area.
Learn MoreRMDS Lab Inc.
225 S Lake Ave. 3rd FL.,
Pasadena, CA 91101


